Summary
- Zoho Reports, online reporting and business intelligence app goes out of beta
- Pricing plans announced
- Wide feature set: Upload data from files as well as databases, drag-and-drop interface, variety of charts, pivot table, summary & tabular views, easy collaboration and sharing, SQL querying etc
- New dashboard view and iGoogle gadget to aid in visual analysis of business information
- Video intro of Zoho Reports
We're happy to announce that Zoho Reports, our online BI & reporting tool has graduated out of beta today. Zoho Reports helps businesses make better sense of their data by providing useful insights through powerful reporting and analytics, which transforms to informed decision making. It achieves this through an impressive set of capabilities that lets users easily perform a variety of tasks, such as:
- Upload any data. Zoho Reports lets users securely upload spreadsheets and tabular data such as .CSV, .TSV, .XLS or .HTML files. Of course, users can also add data directly using the spreadsheet-like interface.
- Push data from any application. Zoho Reports works with hosted and traditional (in-house, behind a firewall) business applications and databases for reporting and analysis. Users can fetch and upload data into Zoho Reports from Oracle, Oracle, SQL Server, MySQL and MS Access databases. Automatic periodic uploads/synchronization is also supported.
- Drag-and-Drop interface. Users can visually analyze and build insightful reports and dashboards using a drag-and-drop interface, all by themselves.
- Use a variety of reporting components. Users have access to a wide range of reporting components, including charts, pivot tables, tabular view and dashboard components that ensure the most insightful report building and analysis possible.
- Query with SQL. Zoho Reports lets users create powerful and flexible reports with SQL queries written in any database dialect/syntax.
- Collaborative analysis. Users can develop reports together, enabling informed, collaborative business decisions. Reports can easily be shared with fine-grained access control, giving the report owner complete control over data and reports being shared.
- Embed reports anywhere. Zoho Reports encourages widespread consumption of business intelligence by enabling users to embed reports in websites, intranets, blogs, applications, iGoogle and Microsoft SharePoint Server.
- Secure all data and reports. Zoho Reports maintains a highly secure environment for all user data. Access to data and reports is secured with a proper user name and password, via HTTPS (SSL connection) network connectivity. All data and reports are hosted in highly secure datacenters, which offer redundancy, backup and continuity.
New functionalities in this release include,
- Dashboard view. Users can collate similar reports and view them all on a single page. For instance, a dashboard page consisting of 10 reports can be displayed in a “5x2” (five rows and two columns) format.
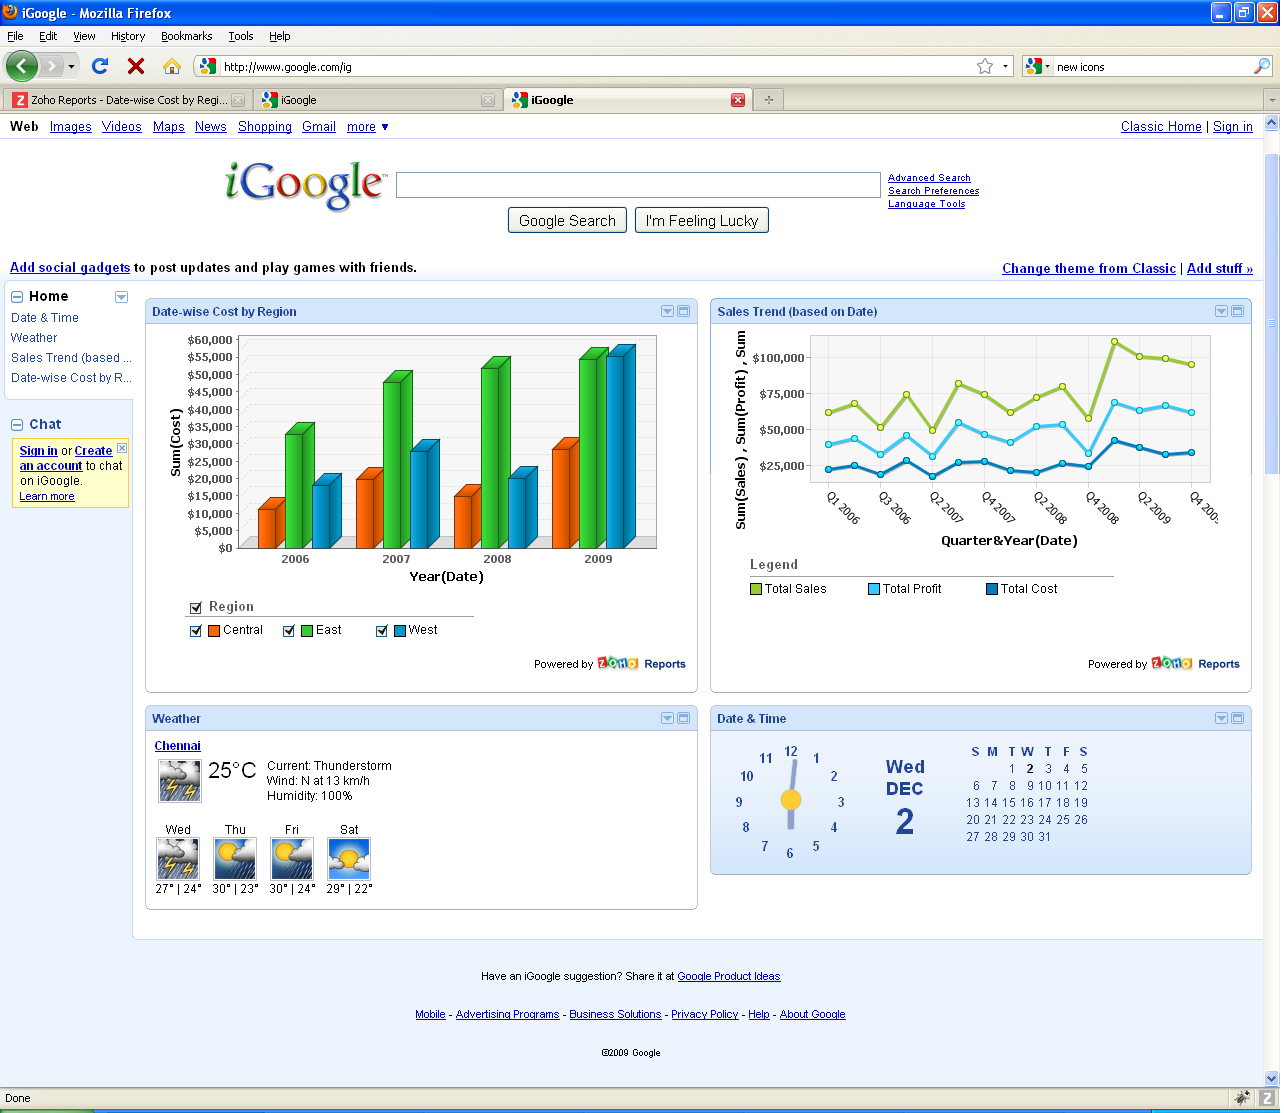
- iGoogle gadget. Users can embed the gadget version of Zoho Reports in their iGoogle home page, giving them ready access to their reports and dashboards from their iGoogle page.
A short video intro to Zoho Reports below.
Like other Zoho products, Zoho Reports offers a generous free edition. And the pricing plans start at $15 per month (for 250,000 rows and 2 users). Take a look at Zoho Reports. We hope you'll like it.
Some screenshots
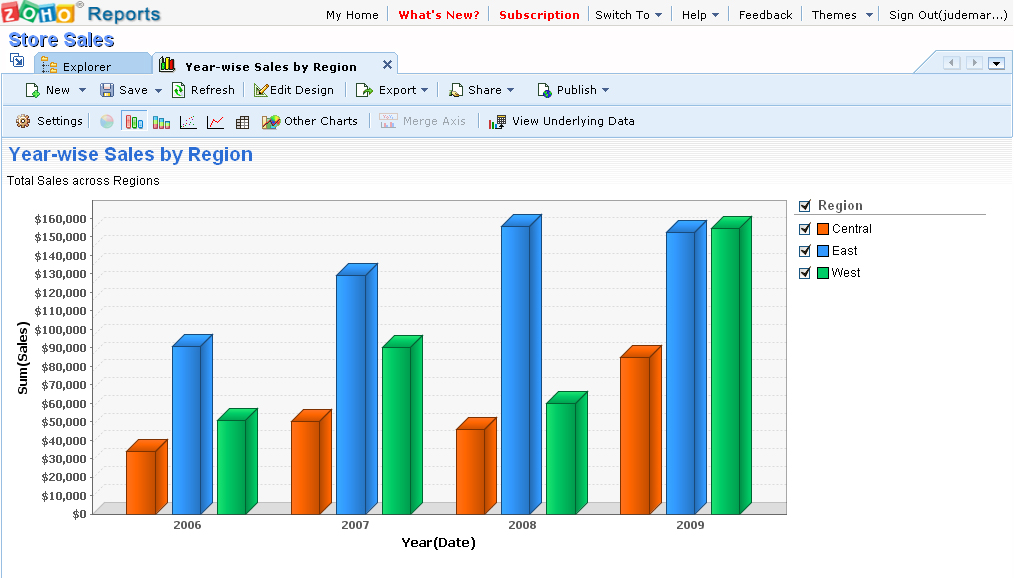
3D Multi-bar Chart
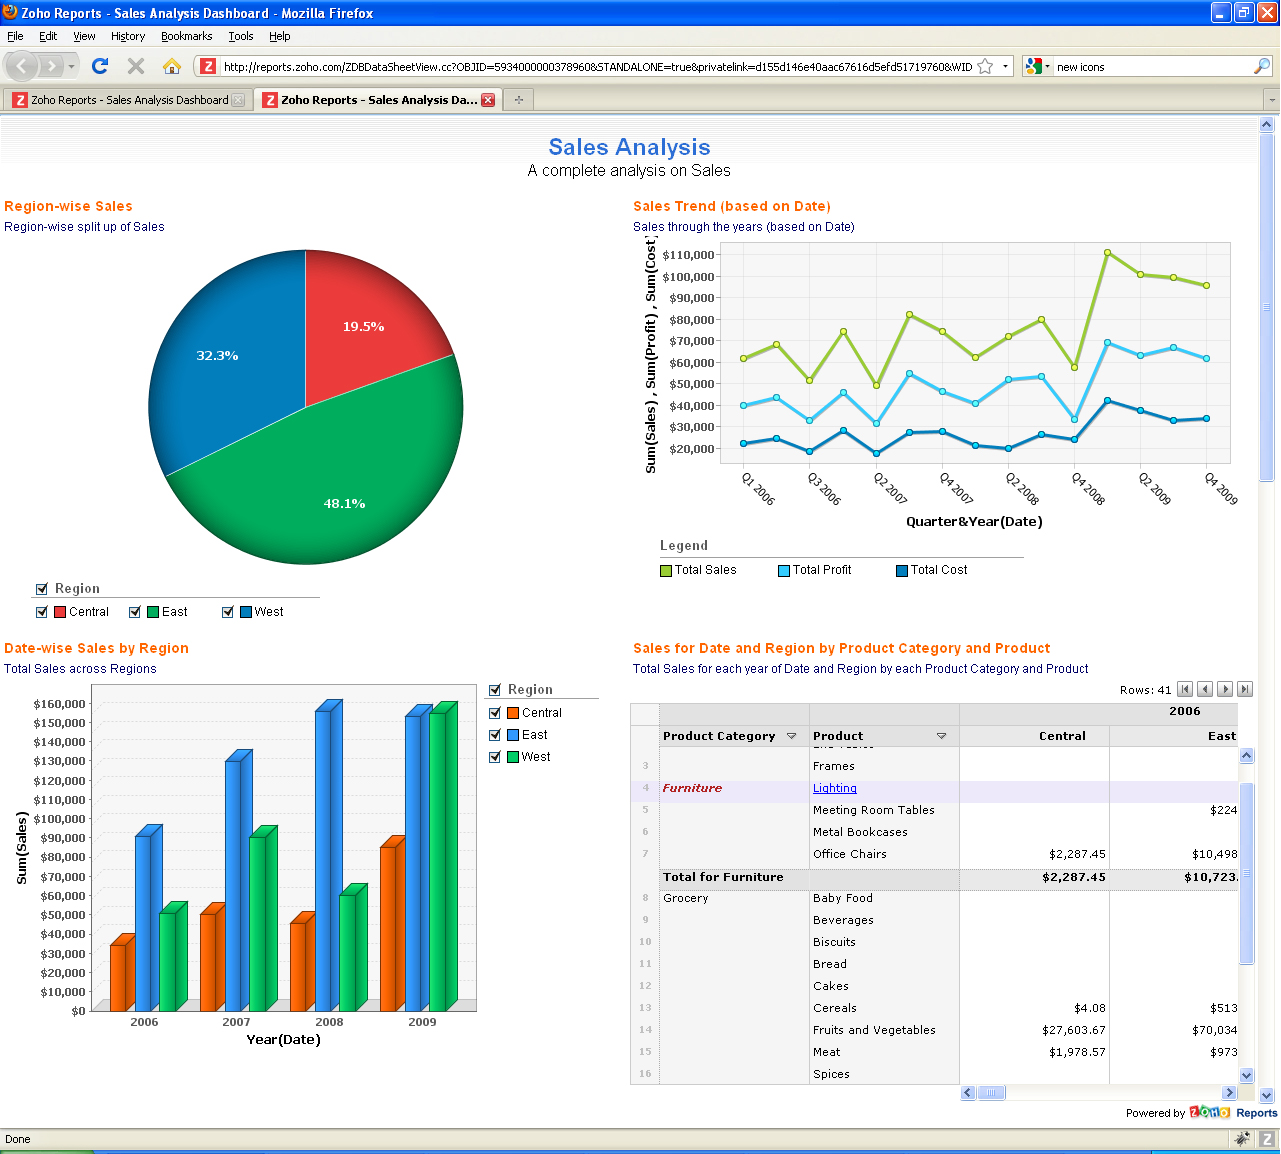
Dashboard - Multiple reports in single page
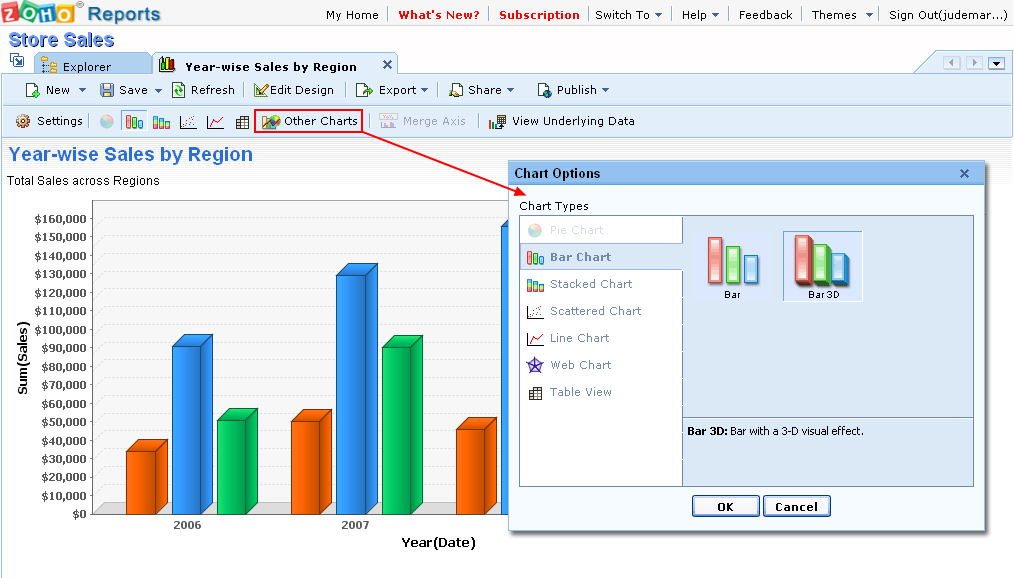
A variety of chart options available
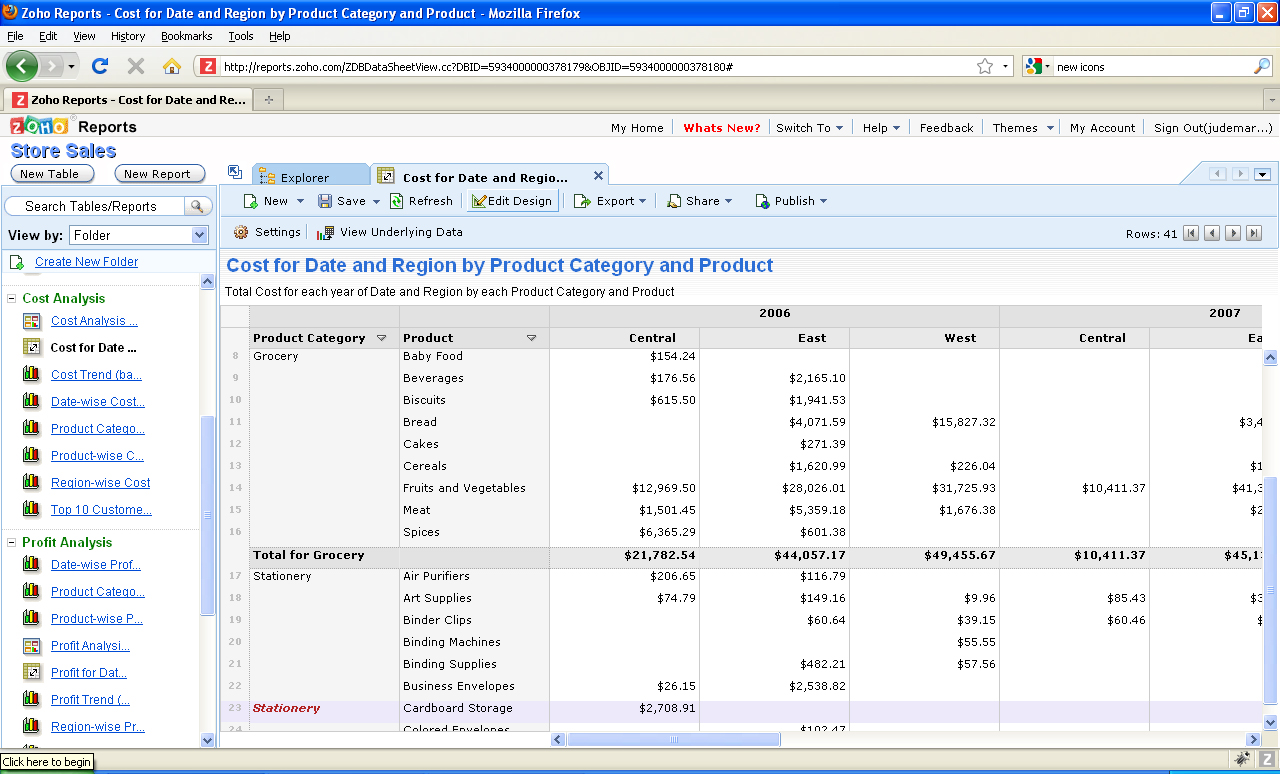
A pivot table
Embed in iGoogle
 Uploading ....